
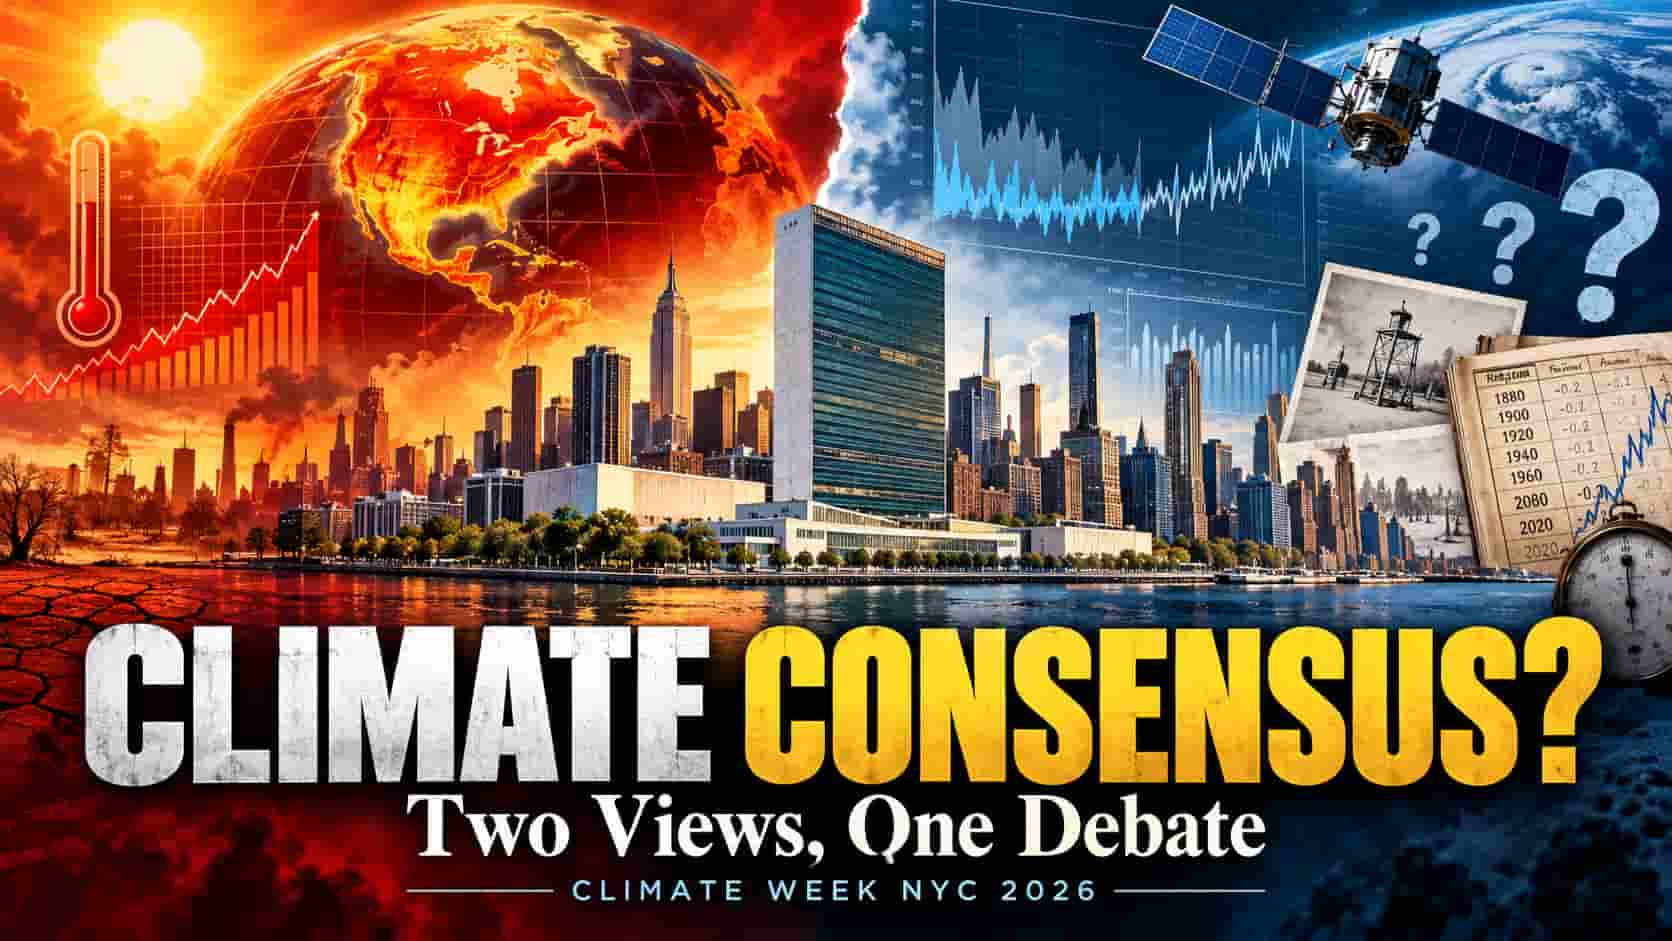
Two broad scientific positions, conflicting interpretations of the same observations, historical temperature patterns — and questions New York should be asking this week
NEW YORK — September 24, 2026. Climate Week NYC is underway from September 20 through September 27, alongside the United Nations General Assembly and the UN Climate Summit.
Climate Week NYC says more than 100,000 people participate in events across the city, bringing together governments, corporations, scientists, investors and advocacy organizations around climate and energy policy.
On September 24, the United Nations Climate Summit is holding a three-hour Information Integrity Solutions Dialogue from 10 a.m. to 1 p.m., followed by a session on Accelerating Green Industrialization from 1:30 p.m. to 3:30 p.m.
That makes one question especially relevant:
What exactly does “scientific consensus on global warming” mean?
The phrase is often used as though climate science consists of one complete theory on which scientists agree.
The documentary record is more complicated.
There is strong agreement within major scientific institutions that greenhouse gases emitted by humans are warming the climate and create significant risks.
There are also scientists, government-appointed researchers and professional organizations that dispute important parts of that assessment — including the magnitude of warming attributable to CO₂, climate sensitivity, natural variability, carbon-cycle dynamics, model reliability, extreme-weather attribution and the costs and effectiveness of specific climate policies.
Those two facts can exist at the same time.
VIEW ONE: Major scientific institutions say human greenhouse gases are driving dangerous warming
In 2025, the National Academies of Sciences, Engineering, and Medicine published:
Effects of Human-Caused Greenhouse Gas Emissions on U.S. Climate, Health, and Welfare.
The report concluded that the EPA’s 2009 finding that human-caused greenhouse-gas emissions adversely affect public health and welfare remained accurate and was supported by even stronger evidence available in 2025.
But there is an important detail about the word consensus itself.
The National Academies calls the document a Consensus Study Report.
Its own explanation says such a report documents the evidence-based consensus reached by the report’s authoring committee of experts on the defined statement of task, following independent review.
That is not the same proposition as saying:
Every scientist agrees with every conclusion about global warming, climate models, climate damages or climate policy.
The distinction matters.
National Academies — 2025 Consensus Study Report
Read the full National Academies report
NASA: long-term warming, but temperatures do not rise every year
NASA’s latest global-temperature analysis provides another useful example of why climate data should not be reduced to slogans.
NASA says 2024 remains the hottest year in its record.
But NASA also states explicitly:
Global temperatures in 2025 were cooler than 2024.
NASA measured the 2025 global surface-temperature anomaly at 1.19°C above its 1951–1980 average and says 2025 and 2023 are effectively tied within the uncertainty of the analysis.
NASA also says the ten most recent years are the ten warmest in its global record.
Both observations are true.
The record shows a long-term warming trend.
It also shows year-to-year rises and declines.
Therefore, the scientifically defensible claim is not that global temperature increases every year.
It does not.
NASA — 2025 Global Temperature Data
NASA Global Temperature Indicator
VIEW TWO: A U.S. government working group challenges major parts of the prevailing assessment
In July 2025, the U.S. Department of Energy published:
A Critical Review of Impacts of Greenhouse Gas Emissions on the U.S. Climate.
The report was prepared by a five-member Climate Working Group assembled by Energy Secretary Chris Wright.
DOE says the group reviewed peer-reviewed literature and government data and reached conclusions that differ substantially from many conventional climate-policy assessments.
Among the report’s findings:
- CO₂-induced warming may be less economically damaging than commonly portrayed;
- some claims of increasing U.S. hurricanes, tornadoes, floods and droughts are not supported by the historical data as interpreted by the working group;
- aggressive mitigation policies could impose costs greater than their benefits;
- and individual U.S. policy actions are expected to have “undetectably small direct impacts on the global climate,” with effects appearing only after long delays.
This is an official Department of Energy publication.
That does not mean it represents unanimous scientific opinion, or even unanimous opinion within the federal government.
But it does mean that significant disagreement over climate impacts and climate policy exists in an official U.S. government scientific review.
U.S. Department of Energy — Climate Working Group report and summary
DOE announcement of the Critical Review
Congress has documented scientific disagreement directly
On March 29, 2017, the House Committee on Science, Space, and Technology held an official hearing titled:
Climate Science: Assumptions, Policy Implications, and the Scientific Method.
The witnesses included:
Judith Curry, Professor Emeritus at Georgia Tech;
John Christy, University of Alabama in Huntsville;
Michael Mann, then a Distinguished Professor at Penn State;
and Roger Pielke Jr., University of Colorado.
These witnesses did not hold identical positions on climate attribution, models or policy implications.
The hearing itself demonstrates that serious disagreement existed among credentialed researchers appearing before the same congressional committee.
U.S. House Committee — Climate Science hearing, March 29, 2017
Even a dataset frequently cited by climate-policy critics shows warming
The University of Alabama in Huntsville maintains a satellite-based lower-troposphere temperature record beginning in December 1978.
Its December 2025 Global Temperature Report gives the long-term trend as approximately:
+0.16°C per decade.
The report also says 2025 ranked as the second-warmest year in that 47-year satellite series.
That is important.
UAH data are frequently cited by scientists critical of mainstream climate projections.
But the UAH record itself still shows long-term warming.
So the disagreement cannot accurately be reduced to:
“warming” versus “no warming.”
The dispute includes questions such as:
How much warming is caused by human emissions?
How sensitive is the climate to additional CO₂?
How large is natural variability?
How reliable are model projections?
And what measurable result will particular policies produce?
UAH Global Temperature Report — December 2025
A direct dispute over CO₂: Peter Stallinga versus Ferdinand Engelbeen
The scientific disagreement becomes particularly clear in a presentation published by the Clintel Foundation.
Physicist Peter Stallinga challenges the conventional interpretation of the relationship between atmospheric CO₂ and temperature.
He argues that researchers should examine causality in both directions.
Under Henry’s law, warmer water can release dissolved CO₂. Stallinga therefore argues that temperature-driven changes in oceans and other natural reservoirs may account for more atmospheric CO₂ variability than conventional attribution assumes.
In his presentation, he points to observed time lags between temperature changes and CO₂ changes and argues that CO₂ sometimes follows temperature rather than preceding it.
Watch: Does CO₂ Drive Temperature — or Follow It? Peter Stallinga
Stallinga calls COVID a real-world emissions experiment
Stallinga also examines the temporary reduction in human emissions during the COVID-19 disruption.
His argument is that the slowdown in anthropogenic emissions did not produce the atmospheric CO₂ response that his interpretation of a simple human-emissions model would predict.
He therefore argues that reducing emissions during that period had little visible effect on the short-term dynamics of atmospheric CO₂.
This is a strong claim.
But it is not left unchallenged.
Another Clintel participant disputes Stallinga’s model
During the same discussion, Ferdinand Engelbeen directly challenges Stallinga.
Engelbeen argues that Stallinga’s simple two-reservoir calculation understates how much anthropogenic carbon remains in the atmosphere.
Stallinga responds by acknowledging that he is deliberately testing a simplified first-order two-box model and that more complicated models can contain additional reservoirs such as the biosphere and multiple ocean components.
This is an important example because it is not simply:
“mainstream scientists versus climate skeptics.”
It is disagreement inside a community broadly critical of conventional climate policy.
Clintel’s own video archive contains presentations arguing different positions on the origin of modern atmospheric CO₂.
Among them are:
How Much of the CO₂ Rise Is Human? — Hermann Harde
and:
Why Human Emissions Drive the Modern CO₂ Rise — Gregory Wrightstone.
It also includes:
CO₂ Residence Time: Why Human Emissions Drive the Rise — Ferdinand Engelbeen.
That is scientific disagreement in plain view.
Clintel says there is “no climate emergency”
The Clintel Foundation’s current World Climate Declaration lists 2,079 signatories.
They are not all climate scientists; the list includes scientists, engineers and professionals from other fields.
The declaration states that there is “no climate emergency” and argues that climate science should be less political and climate policy more scientific.
Clintel also explicitly recognizes both natural and anthropogenic causes of warming while disputing the magnitude, models and policy implications emphasized by mainstream institutions.
The number of signatories does not establish that Clintel’s conclusions are correct.
But it does establish something much narrower:
there is not unanimity.
Clintel — World Climate Declaration and signatories
New York’s temperature record is more complicated than “every year gets hotter”
Central Park has one of the longest continuous weather records in the United States.
The National Weather Service says the highest temperature ever measured at Central Park remains:
106°F on July 9, 1936.
During July 2026, Central Park reached 100°F on July 2, six degrees below the 1936 station record.
But another Central Park record points in the opposite direction.
The NWS lists 2023 and 2024 as tied for the warmest annual average temperature in the station’s history, at 57.9°F.
So these two facts coexist:
The station’s hottest individual day remains in 1936.
Its highest annual mean occurred in 2023 and 2024.
This distinction matters.
A historical extreme temperature record does not by itself disprove a long-term rise in average temperature.
But a rising average temperature also does not mean every local extreme must be unprecedented or that old heat records must disappear.
National Weather Service — Central Park all-time climate extremes
NWS — July 2026 Central Park climate report
The Dust Bowl remains visible in modern official climate records
Oklahoma provides another striking example.
The official State Climate Summary, using NOAA NCEI data, says summer temperatures during 2010–2014 reached approximately the level of the 1930s Dust Bowl period.
But it also states that the 1930s remain Oklahoma’s warmest decade-long summer period on record.
At the same time, the report says Oklahoma has warmed by approximately 0.6°F since the beginning of the 20th century.
Again, both statements are true.
Historical temperature patterns are not a smooth upward line.
Official Oklahoma State Climate Summary — NOAA/NCEI data
The world’s official heat record is still from 1913
The World Meteorological Organization continues to list 56.7°C — 134°F — recorded at Furnace Creek, Death Valley, on July 10, 1913 as the highest officially recognized air temperature on Earth.
WMO also notes that some weather historians have questioned old records and that the organization will investigate historical extremes when credible new evidence becomes available.
The survival of an old individual record does not establish that the global average temperature has not increased.
But it does show why individual extreme records and global averages must not be treated as the same measurement.
World Meteorological Organization — World temperature extremes
New York sea level: rising ocean, sinking land — or both?
Climate Week NYC discussions frequently focus on sea-level rise.
NOAA’s latest official table for The Battery in Lower Manhattan covers observations from 1856 through 2025.
It reports a linear relative mean sea-level trend of 2.95 millimeters per year, with a 95% confidence interval of ±0.09 mm/year.
That equals approximately 0.97 feet per century if the historical linear trend were simply extended forward.
But NOAA calls this relative mean sea level.
That distinction is fundamental.
A tide gauge measures the position of water relative to the land on which the gauge is located.
Therefore, the tide gauge alone does not determine whether the entire 2.95 mm/year comes from:
- the ocean rising;
- the land sinking;
- or both processes together.
NOAA — U.S. Linear Relative Mean Sea-Level Trends
USGS confirms New York itself is subsiding
A U.S. Geological Survey-led study examined land movement across New York City.
Its geodetic observations found average subsidence of approximately:
1–2 millimeters per year across the city.
USGS says that average is consistent with regional post-glacial deformation.
However, some locations are sinking faster, and the researchers found that artificial fill, soft sediments and recent building loads may contribute to local deformation.
The research specifically investigated the pressure produced by New York City’s massive built environment.
That does not mean Manhattan’s skyscrapers explain all of the observed relative sea-level rise.
It also means it is inaccurate to assume from the tide gauge alone that the entire observed 2.95 mm/year represents an absolute rise of the ocean surface.
The observed local number contains both water-level and land-motion components.
USGS — The Weight of New York City: Possible Contributions to Subsidence
USGS overview — The Weight of New York City
So is there a “scientific consensus on global warming”?
The most accurate answer depends on the proposition being discussed.
Question 1: Has the climate warmed over the long term?
NASA’s surface record says yes.
UAH’s satellite lower-troposphere record also shows a positive long-term trend.
Question 2: Do major scientific institutions conclude that human greenhouse gases are an important cause of modern warming?
Yes.
The National Academies’ 2025 report strongly supports that conclusion.
Question 3: Do all qualified scientists agree on the magnitude of human causation, climate sensitivity, carbon-cycle mechanisms, model projections, extreme-weather attribution, economic impacts and climate policy?
No.
The congressional record, the DOE Climate Working Group, university scientists and direct scientific debates document disagreements on these questions.
Question 4: Does “consensus” mean unanimity?
No.
Even the National Academies defines its Consensus Study Report in relation to the evidence-based conclusions reached by a particular expert committee addressing a specified statement of task.
So a responsible use of the phrase “scientific consensus on global warming” should always identify:
Consensus on what exact proposition?
Among which scientists?
Measured by what method?
And which questions remain disputed?
Eight questions Climate Week NYC should answer
The UN’s decision to hold an Information Integrity climate dialogue in New York makes these questions particularly timely.
1. What exactly is meant by “scientific consensus”?
Is the claimed consensus about:
the existence of warming;
human contribution to warming;
the percentage attributable to humans;
climate sensitivity;
future temperature;
future damage;
or the policies governments should adopt?
Those are different questions.
2. When does scientific disagreement become “misinformation”?
A scientist disagreeing with an institutional assessment is not automatically correct.
But disagreement with an institutional assessment cannot automatically be classified as misinformation either.
What objective standard will be used?
3. What observation could falsify the dominant climate hypothesis?
Science requires testable propositions.
What observation would cause estimates of climate sensitivity or anthropogenic attribution to be revised downward?
4. What evidence would cause climate critics to change their minds?
The same standard must apply to the other side.
What measurement would lead critics to accept higher climate sensitivity or a longer atmospheric CO₂ adjustment time?
5. How accurately did older climate projections predict observations?
Instead of showing only projections for 2050 or 2100, Climate Week presenters could compare forecasts made 10, 20 and 30 years ago with subsequent measurements.
Where a model performed well, show it.
Where it did not, quantify the difference.
6. How much of New York’s relative sea-level rise is ocean rise and how much is land subsidence?
NOAA measures 2.95 mm/year at The Battery.
USGS finds average NYC land subsidence of about 1–2 mm/year.
What is the best current estimate separating these components?
7. What measurable global climate effect will each policy produce?
For a major regulation or spending program:
How many tons of emissions will it avoid?
What is the estimated effect on global temperature?
By what year?
What is the uncertainty range?
8. What did taxpayers receive for the money already spent?
Climate policy should be evaluated like any other major public program.
How much money was appropriated?
How much was actually spent?
Who received it?
How many tons of emissions were avoided?
What was the cost per ton?
And what measurable environmental outcome resulted?
The debate is more complicated than a slogan
The evidence does not support the claim that there is no warming.
NASA and UAH both show long-term warming.
Nor does the evidence support the proposition that every temperature record must become hotter every year.
It does not.
Central Park’s hottest day remains in 1936 while its warmest annual averages occurred in 2023 and 2024.
Oklahoma’s Dust Bowl summers remain historically exceptional while its overall climate record shows warming.
NOAA shows relative sea-level rise in Lower Manhattan while USGS simultaneously measures sinking land.
The National Academies finds strong evidence of harmful human-caused greenhouse-gas effects.
The DOE Climate Working Group challenges important estimates of impacts and policy effectiveness.
And researchers debating carbon-cycle models directly challenge each other’s assumptions even inside the climate-policy-critical community.
That is not unanimity.
It is a scientific field containing areas of strong agreement, areas of uncertainty and areas of active disagreement.
During a week devoted not only to climate policy but also to “information integrity,” the standard should therefore be straightforward:
State exactly what was measured.
State what was inferred from those measurements.
State the uncertainty.
Identify credible competing explanations.
And when using the word “consensus,” specify exactly what scientists are said to agree on.
Primary Sources
United Nations — Climate Summit 2026 and Solutions Dialogues
Climate Week NYC — Official 2026 Site
National Academies — Full Consensus Study Report
U.S. Department of Energy — Climate Working Group Review
NASA — 2025 Global Temperature Data
NASA — Global Temperature Indicator
University of Alabama in Huntsville — December 2025 Global Temperature Report
U.S. House Committee on Science — 2017 Climate Science Hearing
National Weather Service — Central Park All-Time Extremes
National Weather Service — July 2026 Central Park Climate Report
Official Oklahoma State Climate Summary
World Meteorological Organization — Global Temperature Extremes
NOAA — Relative Mean Sea-Level Trends
U.S. Geological Survey — New York City Subsidence Study
Clintel Foundation — World Climate Declaration
Peter Stallinga — Does CO₂ Drive Temperature or Follow It?
Midtown Tribune Independent USA news from New York
Ask Midtown Tribune about this story
Answers are grounded first in this article. Search all Midtown Tribune reporting from the main AI Search page.
AI-generated summary. Verify important details in the linked original articles.