
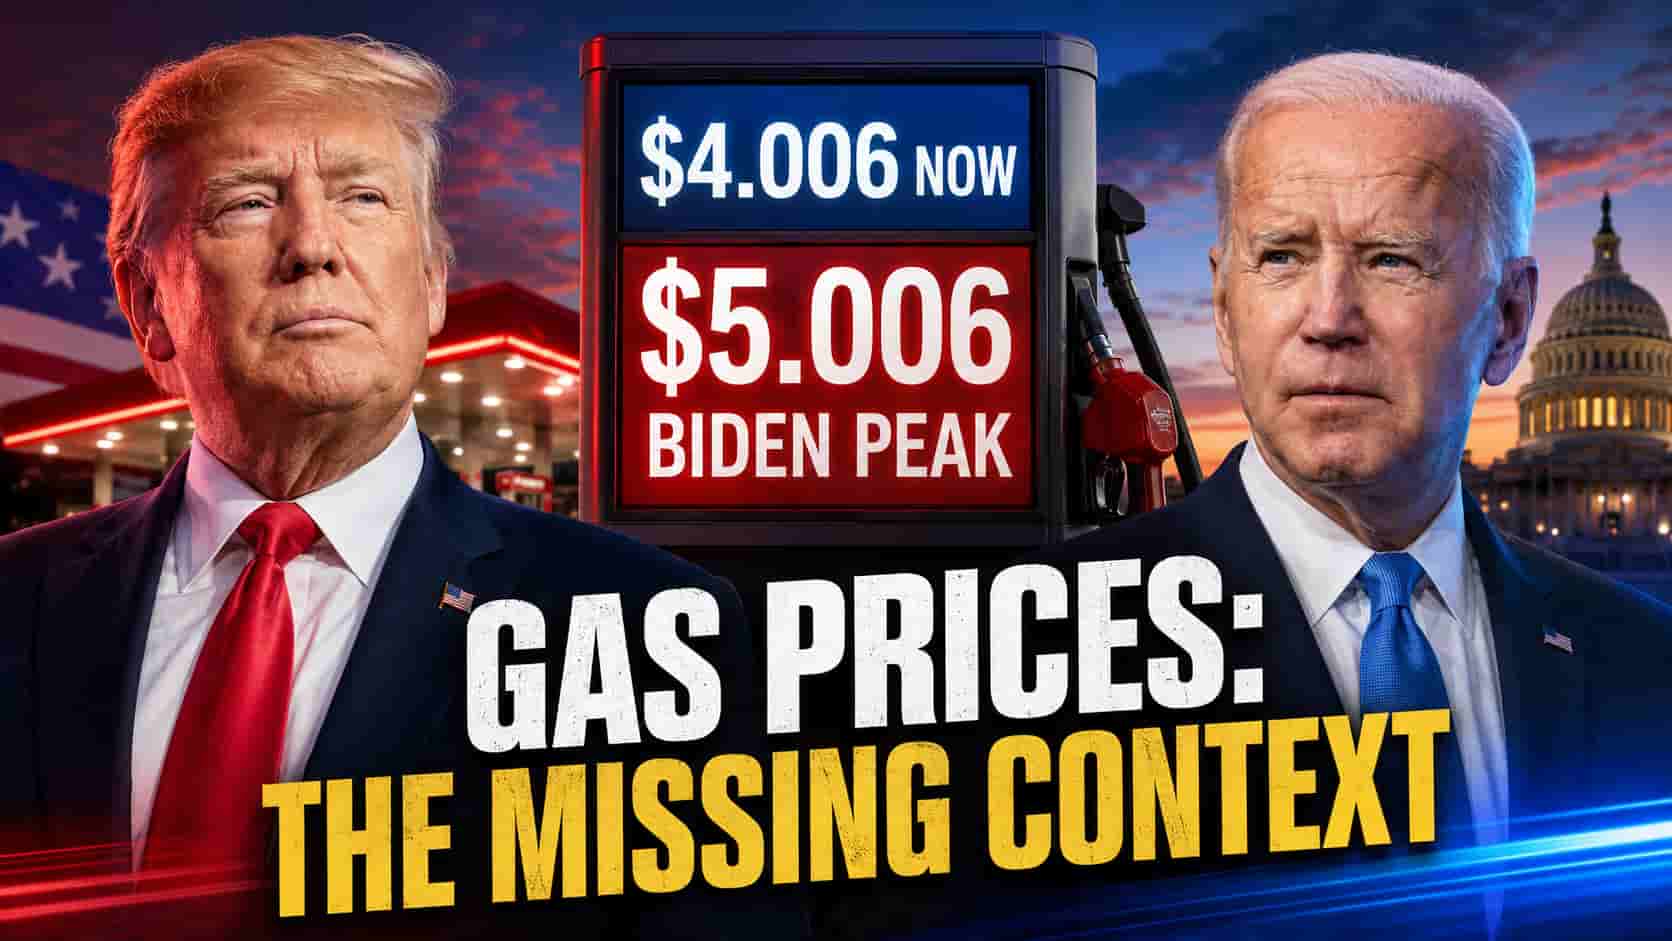
House Democrats posted a blunt verdict on Tuesday: “The Trump economy isn’t working for American families. Grocery prices are up. Gas prices are up. It’s too damn expensive to live in Donald Trump’s America.”
Every line fails as presented. The first and last sentences are political declarations that House Democrats did not prove. The grocery sentence substitutes a broad weighted index for the minimum realistic price sought by a budget-conscious shopper while ignoring sharp declines in eggs and chicken. The gasoline sentence describes the direction of one number correctly, but its intended attribution to “the Trump economy” is unsupported by the federal energy agency’s explanation of a war-related global oil shock—and it conceals a Biden-era national record exactly $1 higher.
That distinction is essential. This fact-check does not claim that the numerical level of every price fell. It finds that none of the four statements survives as a complete and honest factual description of what happened or why. A fragment can be literally correct and still make the overall political claim false by implication.
Most importantly, the statistic behind “groceries are up” does not answer the question an ordinary price-conscious shopper asks: What is the lowest widely available price for a basic item I am willing to buy?
That is not a claim that most Americans are poor or in need. People at many income levels compare stores, switch brands, buy what is on sale and refuse to pay the highest—or even the statistical average—price. For households in need, that behavior is a necessity. For millions of other households, it is simply rational shopping.
The Trump economy isn’t working for American families.
— House Democrats (@HouseDemocrats) August 11, 2026
Grocery prices are up. Gas prices are up.
It’s too damn expensive to live in Donald Trump’s America. pic.twitter.com/uyWlphWDyU
The short verdict: all four lines fail
| House Democrats’ claim | Verdict as presented | What the official data actually show |
|---|---|---|
| “The Trump economy isn’t working for American families.” | Unproved and contradicted as a blanket factual claim | Real GDP was still growing and unemployment was 4.1%. Some households and sectors were under pressure; that does not prove that the entire economy failed American families. |
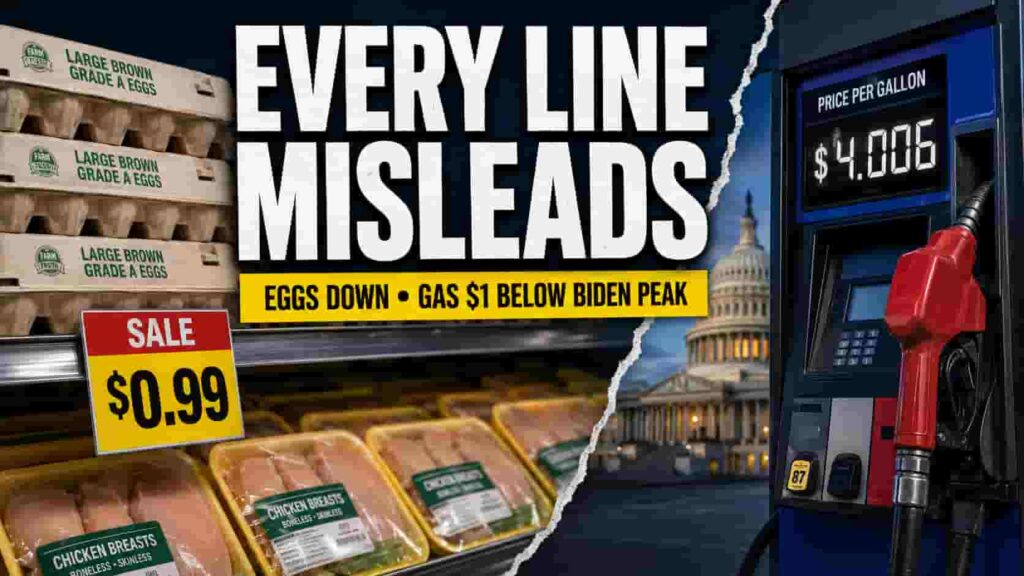
| “Grocery prices are up.” | Misleading—and false if presented as the cost of basic affordable food | The broad food-at-home index was up 2.7%, but eggs were down 27.9%, chicken was down 2.3%, and USDA recorded advertised egg prices below $1 per dozen. The post supplies no minimum-price basket. |
| “Gas prices are up.” | Deceptive without a stated baseline | Gas was up from a year earlier and from Trump’s inauguration week—but down exactly $1 from the Biden-era maximum. EIA tied the 2026 shock to war and the closure of the Strait of Hormuz. The post hides both the baseline and the cause. |
| “It’s too damn expensive to live in Donald Trump’s America.” | Rhetoric presented without a testable standard | “Too expensive” is not defined, no household budget is supplied, and the phrase assigns a complex price level to one president without proving causation. |
The first trick: an index is not the price on the shelf
The Bureau of Labor Statistics says the Consumer Price Index measures the average change over time in prices paid for a representative basket. It is an inflation measure—not a list of the cheapest prices currently available.
BLS makes the distinction explicit. Its CPI measures price change, while its separate “average price” series estimates the average price paid for selected products. Neither series is designed to answer a third question: the lowest broadly available price for a standardized basic product.
That distinction matters because “the grocery index rose 2.7%” and “a careful shopper must pay 2.7% more for an affordable meal” are not equivalent statements.
House Democrats did not link to a source, define their comparison period, identify a basket of basic foods or show the lowest available price at major stores. They took the direction implied by an aggregate index and turned it into a universal claim about family affordability. That is the manipulation: a valid broad statistic is presented as if it proved a different proposition—that affordable basic food became more expensive for the families supposedly being defended. It does not.
The BLS is not manipulating the public by publishing CPI. CPI is a legitimate and necessary inflation measure, weighted using what consumers actually buy. The political manipulation occurs when an aggregate change is stripped of its limitations and used to imply that all—or even the most affordable—groceries moved in the same direction.
The second trick: “average” is not what a price-conscious shopper chooses
Suppose one supermarket sells conventional eggs for $0.99, another sells them for $2.49 and a premium store sells a specialty carton for $5.99. The mathematical average may describe the market. It does not describe the decision of a shopper who compares prices and buys the $0.99 carton.
This does not mean every shopper always finds the absolute lowest advertised price. Transportation, time, store access, membership rules, product availability and purchase limits all matter. It means that an average—or an aggregate index—cannot be casually substituted for the entry price, the lowest realistic price at which a household can buy the basic product.
USDA already recognizes the importance of advertised prices. Its Agricultural Marketing Service collects weekly promotional prices for hundreds of commodities from major supermarket outlets, primarily using retailer websites. In its July 2026 cage-free egg report, USDA recorded advertised prices for some one-dozen cartons as low as $0.69. That does not prove every New Yorker could buy eggs for 69 cents, or that most households did so. It does prove that sub-$1 egg promotions were real—not imaginary—and that a national average can miss the price available to a shopper willing and able to choose a promotion.
Likewise, a reported $7 carton in New York during the 2025 egg crisis was real for some stores and products, but it was never proof that every household paid $7. The honest comparison requires like-for-like products, similar store access and a clearly stated measure.
What happened to basic food prices?
The latest CPI available when House Democrats posted their message covered June 2026. BLS reported that the overall food-at-home index rose 0.2% for the month and 2.7% over 12 months. From December 2024, just before Trump returned to office, through June 2026, the unadjusted food-at-home index rose approximately 4.3%.
But the broad index conceals large moves in opposite directions:
| Basic category | 12-month change through June 2026 |
| Eggs | −27.9% |
| Chicken | −2.3% |
| Poultry overall | −0.1% |
| Dairy and related products | +0.4% |
| Pork | +2.4% |
| Beef and veal | +11.8% |
| Fruits and vegetables | +5.3% |
USDA’s national retail series put a dozen large Grade A eggs at an average of $6.23 in March 2025, at the height of the egg-price shock. By May 2026, that average had fallen to $2.19. USDA’s separate promotional reports showed even lower advertised prices: the average advertised price for conventional caged eggs was $1.25 per dozen in early June, and some cage-free cartons were advertised below $1 in July.
Chicken also became cheaper year over year. Beef did not. It would therefore be inaccurate to say that “meat” as an entire category fell. A precise statement is that eggs and chicken—two widely used, lower-cost proteins—became cheaper, while beef rose sharply and pork rose modestly.
House Democrats’ wording erases those differences. A household that substituted chicken for beef, bought promoted eggs and selected store brands could experience a very different grocery bill from the broad index. A household that bought a great deal of beef or fresh produce could experience worse inflation than the index.
What should be measured for ordinary shoppers?
If politicians want to make claims about the ability to put affordable food on the table, they should publish a Basic-Food Entry Price alongside CPI. A defensible version could be calculated as follows:
- Define standardized staples: a dozen conventional large eggs, a pound of basic chicken, ground meat, milk, rice, potatoes, bread and seasonal produce.
- Record the lowest publicly available unit price at each major supermarket chain in a region, including ordinary promotions but identifying loyalty-card, coupon and quantity restrictions separately.
- Use the median—or a trimmed average—of those store-level minimum prices so that one unusual loss-leader does not determine the entire result.
- Report store coverage and neighborhood access, because a low price 30 miles away is not meaningfully available to every household.
- Publish both the basic-basket entry price and the broad CPI. They answer different questions.
USDA’s Thrifty Food Plan already acknowledges the policy need for a “nutritious, practical, cost-effective” diet and serves as the basis for SNAP benefits. USDA’s supermarket feature reports already collect advertised prices. But the federal government does not currently publish a simple national “average of local minimum prices” for the basic basket described above.
Until such a measure exists, neither side should pretend that CPI answers the minimum-price question. Democrats may cite the broad grocery index, but they should not use it to conceal falling prices for eggs and chicken. Republicans may cite a 69-cent promotion, but they should not present one low advertised price as the price paid by the whole country.
Grocery verdict: the blanket claim is false as presented
“Grocery prices are up” can be defended only as shorthand for one narrow fact: the BLS food-at-home index is higher. But House Democrats did not say “the weighted food-at-home index rose.” They used the phrase inside an accusation about the cost of living for American families. In that intended meaning, the blanket claim is false as presented, because it treats a mixed market as a uniform increase and omits falling entry-level staples.
The official record shows all of the following at the same time:
- the aggregate grocery index increased;
- eggs fell dramatically from their 2025 peak;
- chicken became cheaper year over year;
- some egg promotions fell below $1 per dozen;
- beef and produce became more expensive; and
- no federal series tells us the minimum widely available price faced by price-conscious shoppers or households in need.
The responsible conclusion is not that every product is cheaper. It is that House Democrats selected the broad measure that supported their slogan and omitted the basic categories that moved sharply in the opposite direction. Their wording asks readers to believe something the evidence does not establish: that basic affordable food generally became more expensive.
What the grocery slogan hides
| What readers are encouraged to believe | What the official figures show |
| Basic groceries generally became more expensive | Eggs fell 27.9% and chicken fell 2.3% year over year. |
| The broad CPI reflects the price a careful shopper must pay | BLS says CPI measures average price change for a weighted basket; it does not measure the lowest realistically available price. |
| Sub-$1 eggs are merely anecdotal | USDA recorded advertised one-dozen egg prices as low as $0.69 in July 2026. |
| The same trend applies to every kind of meat | Chicken fell, pork rose 2.4%, and beef and veal rose 11.8%. The market moved in different directions. |
| House Democrats proved worsening affordability for people in need | They supplied no basic-food basket, no minimum-price series, no store-access measure and no comparison period. |
Gasoline: the number is up, but the accusation is false
EIA reported a nationwide average of $4.006 per gallon for regular gasoline on August 10, 2026. That was 88.8 cents higher than a year earlier, an increase of about 28.5%, and 89.7 cents above the $3.109 recorded during the week of Trump’s January 20, 2025 inauguration. It was also 7.3 cents lower than the previous week.
The isolated numerical statement that the national average is higher is true. The accusation built around it—that this rise demonstrates a failing “Trump economy”—does not follow from the evidence and is false as a causal claim. Its presentation omits two decisive facts.
“Gas is up”—compared with what?
| Comparison selected | EIA price | Change to August 10, 2026 | Honest conclusion |
| One year earlier | $3.118 | +$0.888 / +28.5% | Gas is higher year over year. |
| Trump inauguration week, January 20, 2025 | $3.109 | +$0.897 / +28.9% | Gas is higher than at Trump’s return to office. |
| Previous week | $4.079 | −$0.073 / −1.8% | Gas was falling when House Democrats posted. |
| Biden-era maximum, June 13, 2022 | $5.006 | −$1.000 / −20.0% | Gas is exactly $1 cheaper than the Biden-era record. |
House Democrats wrote “Gas prices are up” without saying from which date. That omission is the deception. Relative to the date that produces their preferred result, the number is up. Relative to the maximum reached under Biden, it is down by exactly $1 per gallon. A political account should not be allowed to hide the baseline and then present its preferred comparison as the only truth.
This does not mean the Biden-era maximum is the only possible baseline. A peak comparison can also exaggerate improvement if used alone. The honest method is to show all relevant baselines—as the table above does—and allow readers to see both the current increase and the much higher Biden-era record.
First, EIA linked the 2026 petroleum-price shock to military action in the Middle East on February 28 and the subsequent de facto closure of the Strait of Hormuz. Crude oil is the largest component of retail gasoline prices. The increase cannot honestly be reduced to ordinary domestic economic policy.
Second, EIA’s weekly series shows that regular gasoline reached $5.006 per gallon on June 13, 2022, under President Biden. The August 2026 price was exactly $1 lower. From the EIA price in each president’s inauguration week to the later comparison point, gasoline rose about 110% before the Biden-era peak and about 29% from Trump’s 2025 inauguration week to August 10, 2026.
| Presidential-period comparison | Starting price | Later price | Increase |
| Biden inauguration week → Biden-era maximum | $2.379 | $5.006 | +$2.627 / about +110% |
| Trump inauguration week → August 10, 2026 | $3.109 | $4.006 | +$0.897 / about +29% |
By this defined comparison, the increase under Trump was not merely smaller: it was less than one-third of the percentage increase from Biden’s inauguration week to his administration’s maximum. Leaving that history out turns a partial number into a partisan impression.
Both episodes require geopolitical context. The 2022 record followed Russia’s invasion of Ukraine and a global energy shock. The 2026 increase followed another war-related disruption, this time at the Strait of Hormuz. The increase under Trump has so far been much smaller, but neither president alone set the world oil price. House Democrats cannot reasonably demand geopolitical context for Biden’s record while erasing it from Trump’s increase.
Did Democratic energy policies destroy U.S. extraction?
The Biden administration did pursue policies intended to restrict or discourage some fossil-fuel development. Executive Order 14008 ordered a pause on new oil and natural-gas leasing on federal lands and offshore waters while the government reviewed leasing practices and climate effects. The administration also canceled leases in Alaska’s Arctic National Wildlife Refuge and imposed other restrictions.
Those decisions created legitimate concerns about investment, permitting and long-term supply. But saying Democrats literally “destroyed” the U.S. extraction industry would contradict EIA data. The United States produced a record 12.9 million barrels of crude oil per day in 2023 and set another record in August 2024.
The accurate criticism is narrower: Democratic administrations and states erected additional policy barriers to domestic fossil-fuel development in the name of climate policy, even while production on private and state lands helped push national output to records. That is a serious policy argument without making a claim the official production numbers disprove.
New York restricts local energy while importing Canadian power
New York has rejected high-volume hydraulic fracturing and built the Champlain Hudson Power Express to carry Hydro-Québec electricity into New York City. NYSERDA says the line is expected to deliver 10.4 terawatt-hours annually and could meet up to 20% of New York City’s electricity demand.
That is not 20% of the entire state’s electricity. EIA reported that on July 3, 2026, during a heat wave, Canadian imports supplied 9% of statewide NYISO demand. Before the new line opened, Canada supplied 3% of NYISO demand in 2024 and about 2% through August 2025.
The policy question remains valid: why should an energy-rich state restrict domestic production, import more power from a foreign supplier and export the associated investment and jobs instead of building enough reliable energy to serve New Yorkers and potentially sell a surplus?
Claims that global warming simply “failed to occur” by 2018 are not supported by official temperature records. NOAA and NASA classified 2018 as the fourth-warmest year in the modern record at that time. Specific apocalyptic predictions made by politicians or activists can and should be checked individually, but they should not be confused with the scientific temperature record.
“The Trump economy isn’t working”: not established by the data
Presented as a fact, that conclusion is not established. It is a campaign judgment contradicted by indicators that were positive even while affordability problems remained. The federal data available around the House Democrats’ post showed a mixed economy:
- consumer prices were 3.5% higher than a year earlier;
- real average hourly earnings rose only 0.1% year over year;
- real GDP grew at a 1.5% annual rate in the second quarter; and
- unemployment stood at 4.1% in July.
Affordability pressure is real. So are continued economic growth, a relatively stable labor market, falling egg prices and cheaper chicken. A social-media slogan cannot fairly turn that mixed record into proof that an entire economy has failed. The claim may express the Democrats’ political opinion, but it is false if offered as a conclusion demonstrated by the cited price movements.
Bottom line
House Democrats are using a familiar statistical shortcut. They take an aggregate grocery index—which measures average price change across a broad weighted basket—and present it as a description of what families must pay for affordable food.
That is not what the index measures.
Most shoppers are not necessarily in need, but most have no reason to choose a higher price when an acceptable lower-priced product is realistically available. People in need—by the very meaning of the term—face the strongest constraint: they must seek promotions, substitute cheaper foods, use assistance or obtain food from distributions. A serious affordability analysis must therefore show both the broad inflation trend and the entry price for a basic basket.
The honest verdict is straightforward: all four lines fail in their intended political meaning. The economy was still growing, so its alleged failure was not proved. The grocery market was mixed, with eggs and chicken down and advertised eggs below $1, so a blanket affordability claim was false. Gas was numerically higher, but EIA identified a war-related world-market shock and the price remained $1 below the Biden-era record, so blaming “the Trump economy” was unsupported. “Too expensive to live” was an undefined slogan, not a measured fact.
House Democrats found fragments that sounded useful and discarded the context that changed their meaning. That is not a complete fact-check of family affordability. It is political advertising dressed as economic analysis.
Official Government Data Used in This Fact-Check
- U.S. Bureau of Labor Statistics — CPI Frequently Asked Questions: CPI measures average price change for a representative basket and may not match an individual household’s inflation experience. BLS.gov — CPI methodology
- U.S. Bureau of Labor Statistics — Average Price Data: the difference between a price index and an estimate of average prices paid. BLS.gov — average prices
- U.S. Bureau of Labor Statistics — Consumer Price Index, June 2026: food-at-home, category and overall inflation data available when the post was published. BLS.gov — CPI release
- U.S. Bureau of Labor Statistics — Consumer Price Index, January 2025: December 2024 grocery-index baseline. BLS.gov — archived CPI release
- USDA Agricultural Marketing Service — Grocery Store Feature Reports: weekly advertised retail prices gathered primarily from retailer websites. USDA.gov — supermarket promotions
- USDA Agricultural Marketing Service — July 2026 Cage-Free Shell Egg Report: regional advertised-price ranges for one-dozen cartons, including sub-$1 offers. USDA.gov — July egg report
- USDA Agricultural Marketing Service — Egg Markets Overview, June 5, 2026: conventional caged egg promotions averaged $1.25 per dozen. USDA.gov — egg market overview
- USDA Food and Nutrition Service — Thrifty Food Plan: the federal model of a nutritious, practical and cost-effective diet used for SNAP. USDA.gov — Thrifty Food Plan
- U.S. Energy Information Administration — Gasoline and Diesel Fuel Update: weekly national gasoline prices through August 10, 2026. EIA.gov — fuel prices
- U.S. Energy Information Administration — Weekly gasoline price history: inauguration-week comparisons and the $5.006 record on June 13, 2022. EIA.gov — price history
- U.S. Energy Information Administration — Petroleum market review: effects of the February 28 military action and de facto closure of the Strait of Hormuz. EIA.gov — market analysis
- U.S. Energy Information Administration — U.S. crude production: record production under Biden. EIA.gov — production record
- U.S. Department of Energy — Executive Order 14008: federal oil and gas leasing pause and climate review. Energy.gov — Executive Order 14008
- U.S. Energy Information Administration — New York imports from Canada: Canadian imports supplied 9% of NYISO demand on July 3, 2026. EIA.gov — New York power imports
- NYSERDA — Champlain Hudson Power Express: projected annual delivery and up to 20% of New York City demand. NYSERDA — CHPE
- New York State Department of Environmental Conservation — HVHF findings: New York’s official high-volume hydraulic-fracturing policy. DEC.NY.gov — HVHF findings
- NOAA — Global climate in 2018: official global temperature ranking. NOAA.gov — 2018 climate
- U.S. Bureau of Labor Statistics — Real Earnings and Employment Situation: real-wage and labor-market context. BLS.gov — real earnings; BLS.gov — jobs report
- U.S. Bureau of Economic Analysis — GDP, second quarter 2026: real economic growth. BEA.gov — GDP release
Data cutoff: August 11, 2026—the date of the House Democrats’ post. The latest CPI then available covered June 2026.
Ask Midtown Tribune about this story
Answers are grounded first in this article. Search all Midtown Tribune reporting from the main AI Search page.
AI-generated summary. Verify important details in the linked original articles.